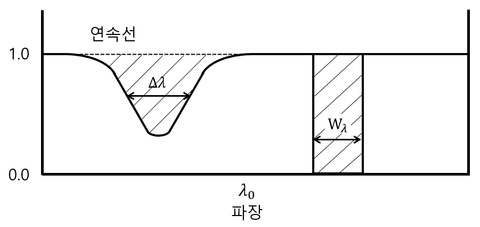
This article follows the previous [Star Luminosity Classes: What is the Line Width of Absorption Lines?].
If you want to deeply understand star luminosity classes, read the following article, then read the article below.
1. Yerkes Classification (M-K Classification)

At the Yerkes Observatory, Morgan (William W. Morgan) and Keenan (Philip C. Keenan) used stellar temperature and the luminosity effect to classify stars two-dimensionally on the H-R diagram.
They determined the luminosity class using the line width of absorption lines affected by surface gravity.
In simpler terms, even if stars have the same temperature, there can be different series with different sizes.
This is called the M-K classification.

Larger stars show the following characteristics due to the luminosity effect on the spectrum.
The line width of neutral hydrogen lines in high-temperature stars becomes narrower and the intensity becomes stronger.
Because the surface density is low, fewer recombinations occur, strengthening the lines of ionized elements.
For the same spectral type, the surface temperature of a main-sequence star is higher than that of a giant.
2. Why Stars Appear Differently on the H-R Diagram
The reason stars have different grades on the H-R diagram despite having similar surface temperatures is due to size differences.
A star with the same temperature appears brighter if it is larger.
It is like comparing one 10w bulb to the brightness of gathering 100 such bulbs.
Let's quantitatively explore this according to the following steps.
1) According to the Stefan-Boltzmann Law, the energy emitted per unit area at temperature T is as follows:

2) Since the shape of a star is approximately spherical with radius R, the total energy (luminosity, L) emitted by the star can be expressed as follows. The luminosity of the star is the product of the surface area of the sphere and the energy emitted per unit area.

3) By substituting the expression from step 1), we obtain the following equation:

4) The above equation indicates that if the luminosity (L) is greater for the same spectral type (same T), the radius (R) is larger.
In high school curriculum, it is fine to think that the luminosity class of stars is simply divided by 'size difference'.
However, a true science enthusiast may wonder about the relation between the line width of absorption lines and star size.
3. Luminosity Effect - Star Temperature and Line Width
Assume you observe the Balmer absorption lines of two stars with similar temperature and chemical composition.
If the star does not have an unusually strong magnetic field, factors 1), 2), and 4) for line width increase are the same.
This leaves factor 3), the Stark effect influencing the line width difference.
The spectrum of the star we observe is emitted at a point with an optical depth of τ = 1, so the surface density difference appears as line width difference.

As the hydrogen in the core of a star is depleted, it begins helium burning and its size increases.
This stage is called the giant phase, where the size of the star becomes enormous.
When the star's size increases, the surface gravity weakens, and the pressure and density of the surface atmosphere decrease.
This results in a narrower line width of absorption lines.
This effect is called the luminosity effect (or surface gravity effect, pressure effect).
Even for the same A-type star, different sizes show different absorption lines. Consider the following order:
1) Star Size: Supergiant > Main Sequence > White Dwarf
2) Surface Gravity (Density) of Star: Supergiant < Main Sequence < White Dwarf
3) Line Width of Absorption Lines: Supergiant < Main Sequence < White Dwarf
The image below shows the spectrum of stars at high evolutionary stages.
As shown in the image above, white dwarfs show a wider line width than stars on the horizontal branch or asymptotic branch.

4. Criteria for Dividing Star Luminosity Classes
Morgan and Keenan at the Yerkes Observatory used the luminosity effect to distinguish star types.
If a star is large, the surface gravity is weak, lowering atmospheric density and causing various effects, known as the luminosity effect.
Stars appear differently positioned on the H-R diagram due to size differences.
The star's luminosity class means that different star types can exist even with the same surface temperature.
In this article, we took an in-depth look at the method of classifying stars by luminosity classes.
In the next article, I might write about the H-R diagram or factors for line width increase.
Hope this helps in your studies.


댓글을 불러오는 중...