I recently had a good opportunity to teach a class on data visualization using Python.
The materials I used in class felt too valuable to just use once and throw away, so I decided to leave them on this blog.
The goal of this post is for someone who only knows the basics of Python like for loops, if statements, and functions to try drawing a graph with Python at least once.
What’s in this post is really just the basics, and I hope you read it with the purpose of laying the groundwork for doing data visualization in Python.
This is the first of a series of posts I’ll be writing, the opening remarks and setting up the Python development environment.
1. Opening remarks
1) What is data visualization?
To put data visualization simply, it means turning data into graphs or other visually appealing forms.
Taking a crappy-looking Bonobono PowerPoint and turning it into a good-looking PowerPoint is really just a difference in how the content is presented.
Data visualization is the same kind of thing.

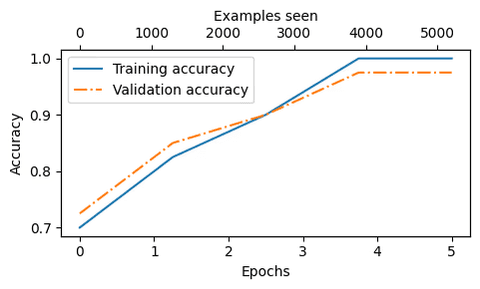
The material below is an example of visualization that I created by using the seaborn visualization package with data downloaded from Coggle (코글).
The graph on the right is much easier to read and interpret than the table on the left.
But then why Python specifically?

Of course, Python is not the only data visualization tool out there.
You can do it with Excel, and there are many other tools as well.
For simple data, you can easily experience data visualization in Excel too.

I think the biggest appeal of learning data visualization with Python is automation.
Once you write a sequence of code, you can create various types of graphs for all your data, or if you have data provided monthly in a certain format, you can visualize it with a single click.

The benefits you feel will differ from person to person. Forcing yourself to stick to the “Python” frame only makes it less fun.
Sometimes, if you’re not sure, you can inspect the data in Excel, or delete and sort data in Excel.
We’re really just learning one more visualization tool.
2) The process of data visualization
The rough process of data visualization is as follows.

For example, let’s say you receive a request to give an information session about entering middle school from an elementary school.
In that case, you might follow steps like those below to perform data visualization.
First, you decide what you’re going to explain to the kids. Among those topics, let’s say you decide to run a survey on “What’s hard about being in middle school?”
Then you collect data by having the kids respond to the survey.
The data you get from the students has no fixed format, so you go through a procedure to tokenize it at the syllable level using a package called KoNLPy. You also need to delete responses that are missing.
You visualize the data using Python’s wordcloud package. If there are unnecessary one-syllable words, you remove them and visualize again to complete the image.
Instead of explaining everything to the kids in a long-winded way, it will probably be more helpful to put up a single image like the one below and talk based on that.

3) Structured data and unstructured data
The above example is a case of unstructured data.
Because unstructured data has no fixed format, you need to process it according to how you want to handle it.
However, this process is quite difficult.

So in this post, I’m going to explain how to inspect data and draw graphs using only structured data, that is, data with a defined format.
Structured data will mostly be numbers.
2. Setting up the Python development environment
If you don’t have Python and VS Code installed, please refer to the post below and install them.
Then, in VS Code, install the Pylance extension.
Pylance offers powerful features, so be sure to install it.

3. Installing packages with PIP
PIP is the Python package manager.
In simple terms, it lets you download programs that others have already written.
First, open the terminal.

Now boldly type in the following commands.
# Window 일 경우
pip install numpy openpyxl pandas matplotlib

# Mac OS 일 경우
pip3 install numpy openpyxl pandas matplotlib
For a brief moment you’ll feel like a hacker. Wait until all the packages finish installing.
In my case, all the packages were already installed, so it shows a message saying they’re already installed.

When installation is done, try entering the following commands.
# Windows 일 경우
pip show matplotlib

# Mac OS 일 경우
pip3 show matplotlib
If it shows something like the screen below, the installation is complete.

To briefly explain the packages: pandas is for handling tabular data, matplotlib is for data visualization, and numpy will be used for matrix calculations and linear regression for graphs.

4. Installing Jupyter Notebook
First, create a folder anywhere you like.
I gave it the time-honored, traditional folder name “직박구리”.
Then in VS Code, click the tab at the top left, click Open Folder, and open that folder.

Now create a file with the following extension.
The extension is .ipynb.
This file is a Jupyter Notebook file.

Type in the classic coding rule text, "hello world", and click the triangle button next to it.
It will start saying things like it’s connecting and installing; just allow everything, and you’ll see “hello world” printed out immediately as shown below.

Because Jupyter Notebook supports cell-based execution, you can write code and debug at the same time while building your program for the first time.
The downside is that it can be a bit slow.

For example, normally when you run Python code, you have to check the results in the terminal, but in Jupyter Notebook you can see the results immediately below the cell where you run the code.
This alone makes coding a lot easier.

5. In the next post...
In this post, we took care of the overall preparation for the next post.
If you can use Python and Jupyter Notebook in VS Code without any issues, there’s nothing more you need to do.
Let’s move on to the next post. That’s it.


댓글을 불러오는 중...